
Class analytics show how one class is using Flint and how its students are doing. You need Can edit access to the class to open them — anyone else is sent back to the class's activities.
- Open the class.
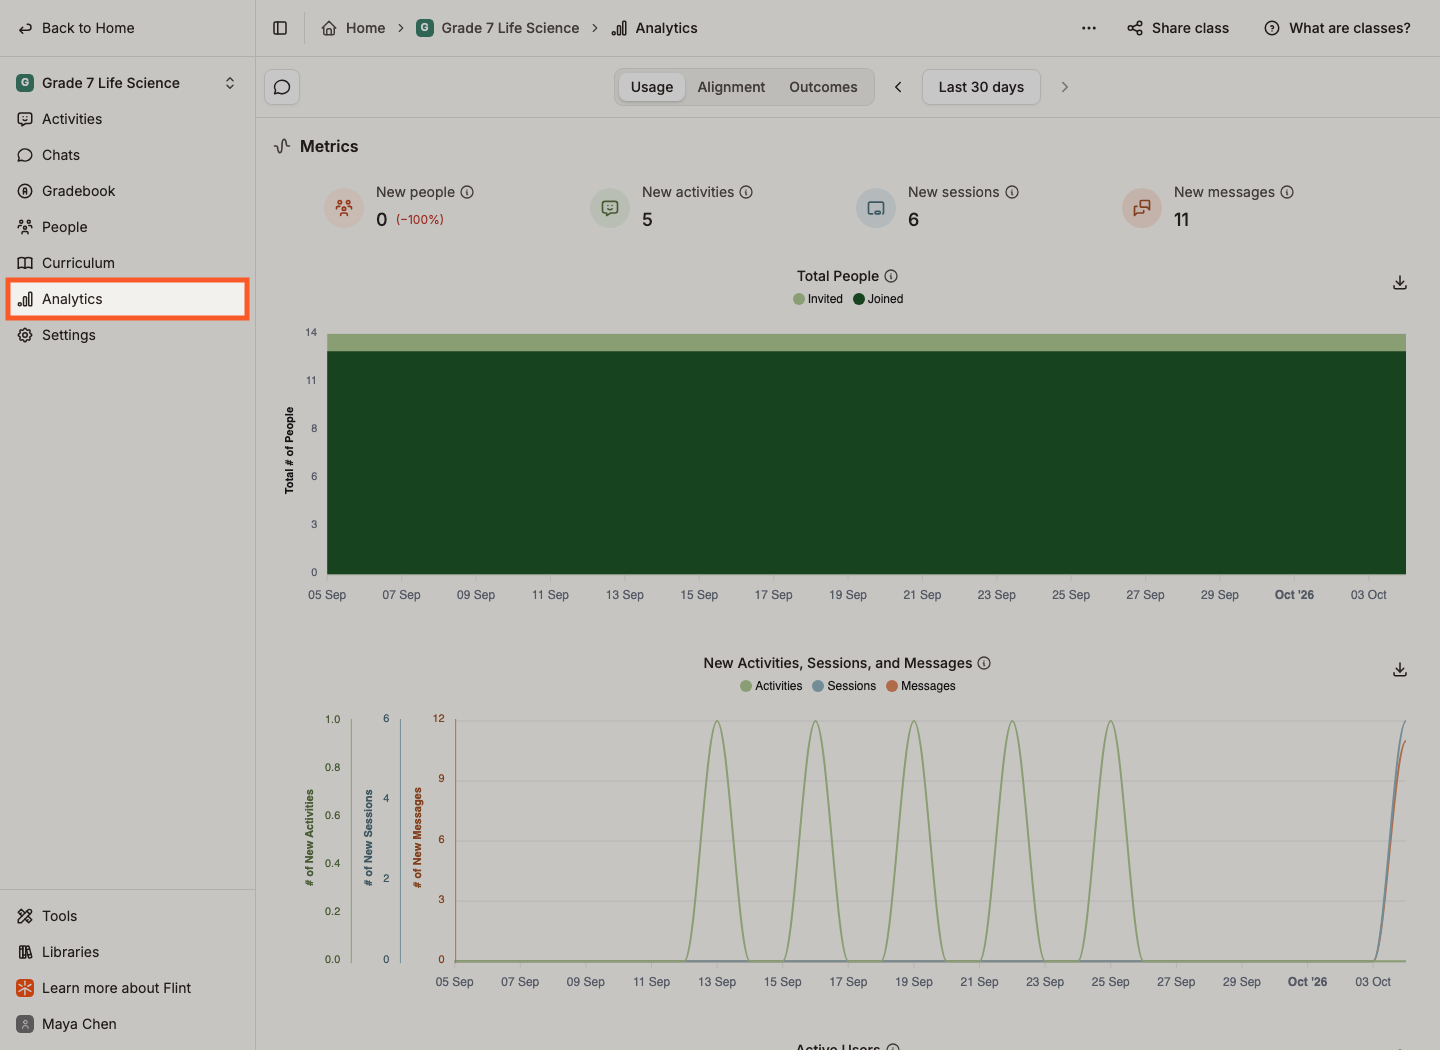
- Click Analytics in the class sidebar.
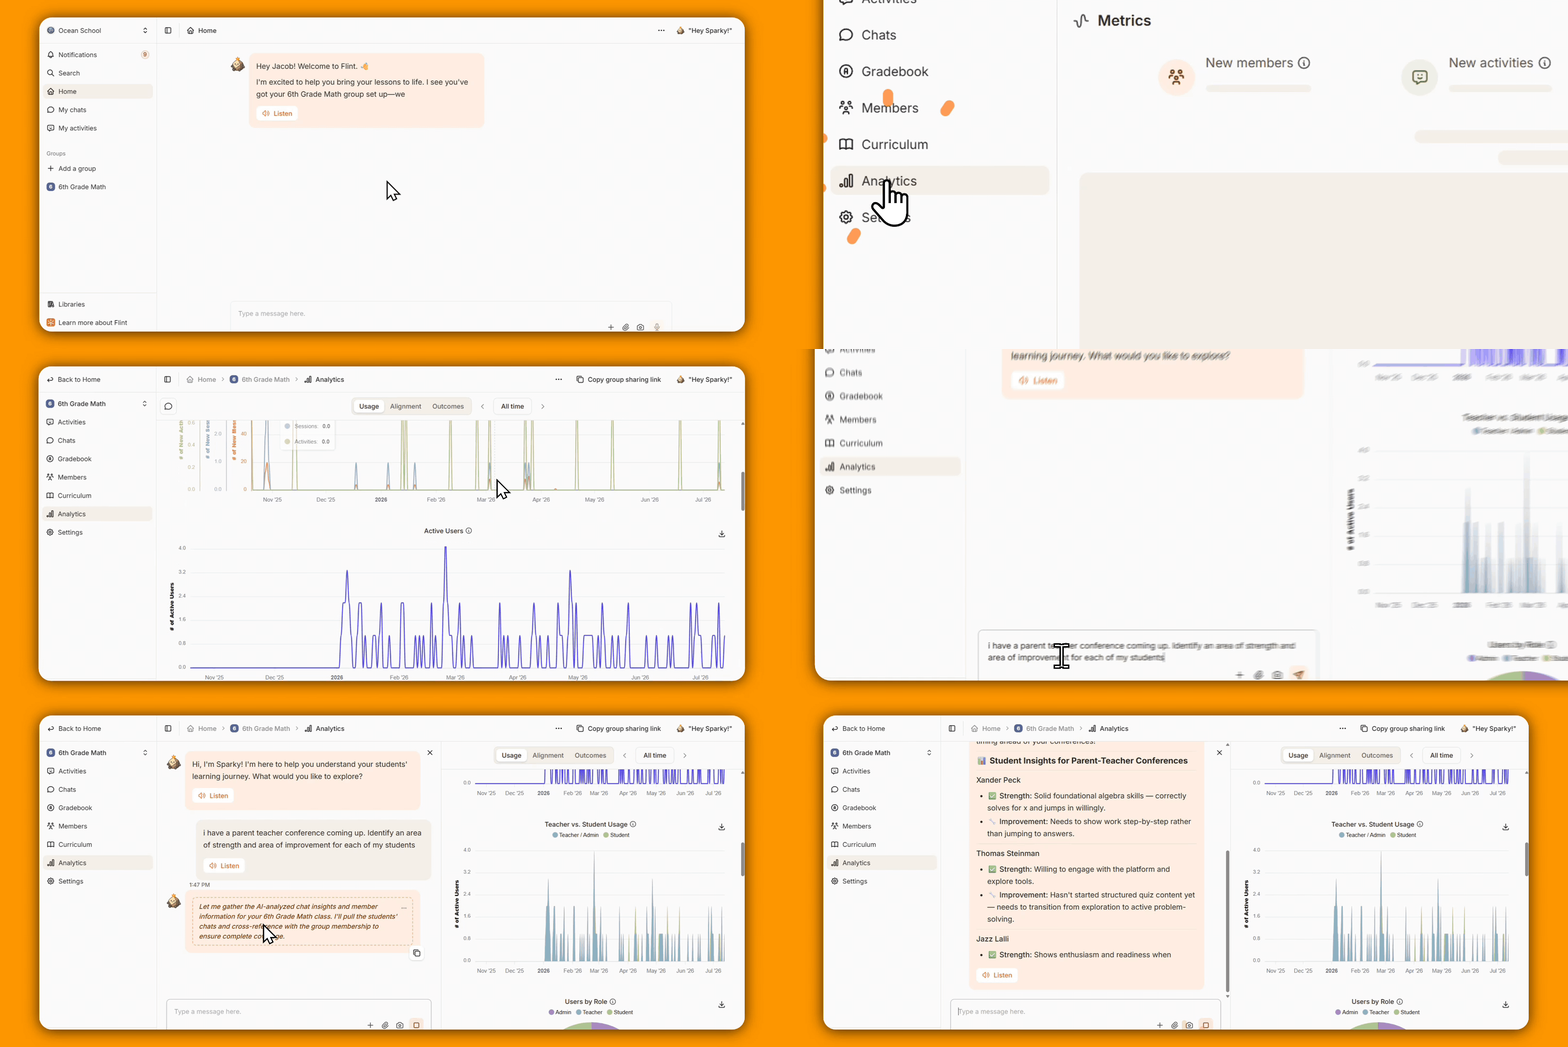
The GIF shows an earlier interface with Groups and Members; current navigation uses Classes and People. Follow the written steps and current screenshots.
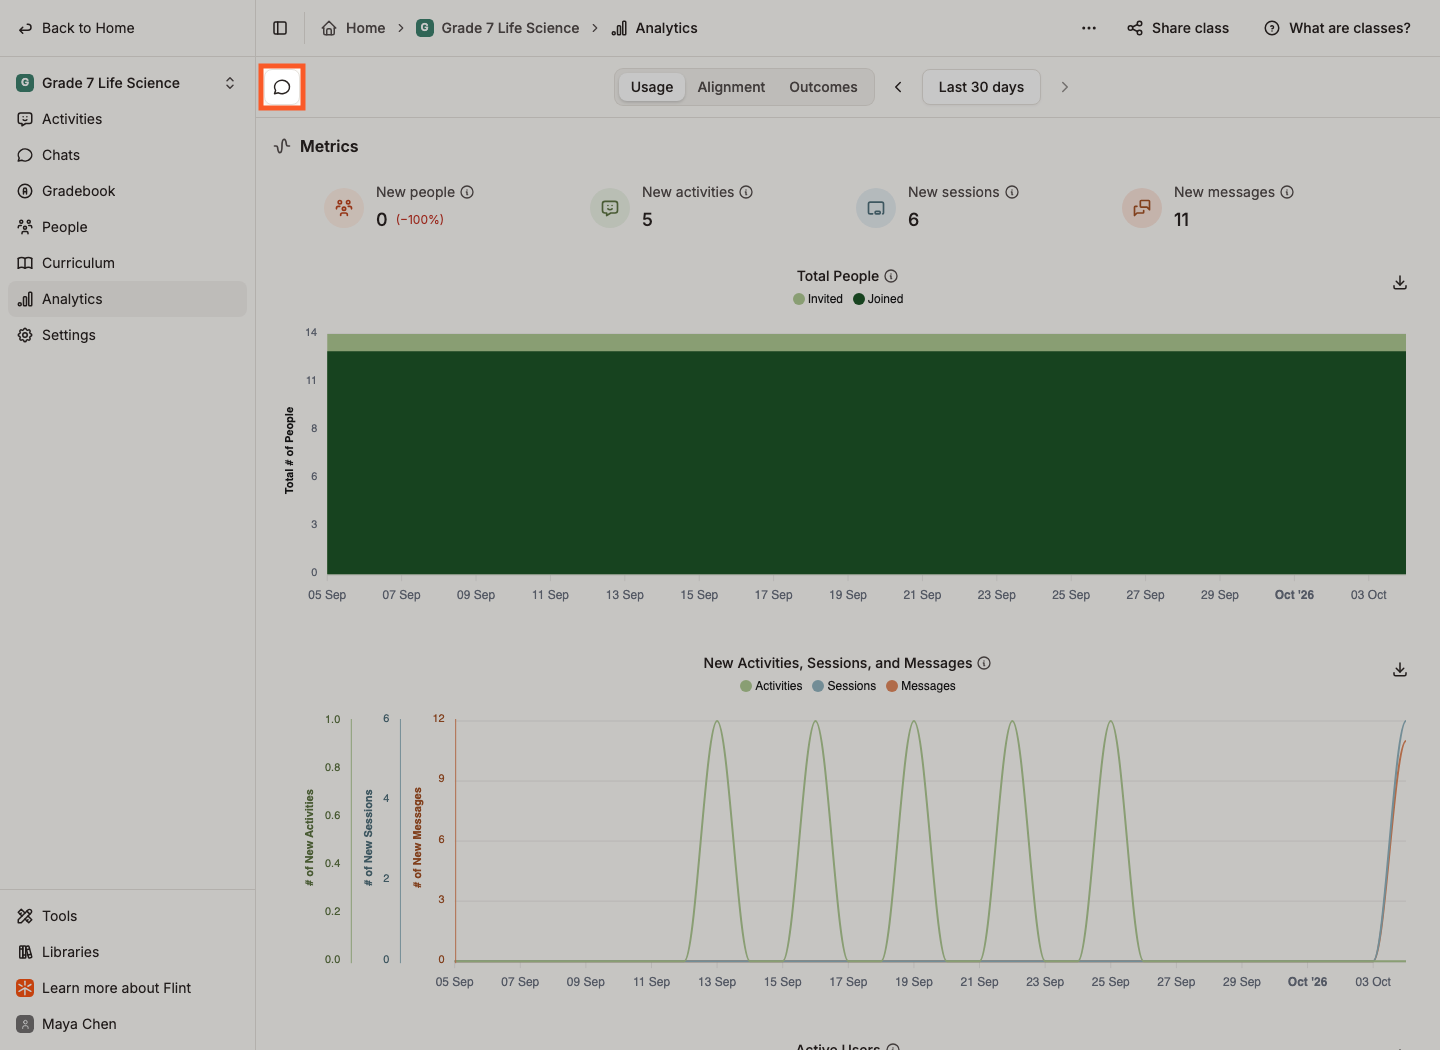
Ask Sparky about your analytics
The speech-bubble button in the top left opens Ask Sparky about your analytics — a chat panel beside the charts. Sparky can read across the sessions and activities in this class, so you can ask things like:
- I have parent-teacher conferences coming up. Give me a strength and an area for improvement for each student.
- How has this student improved over the last three activities?
- What are my students consistently struggling with?
- Based on the last three activities, what should I work on with them next?
Collapse chat closes the panel again.
Choose a date range
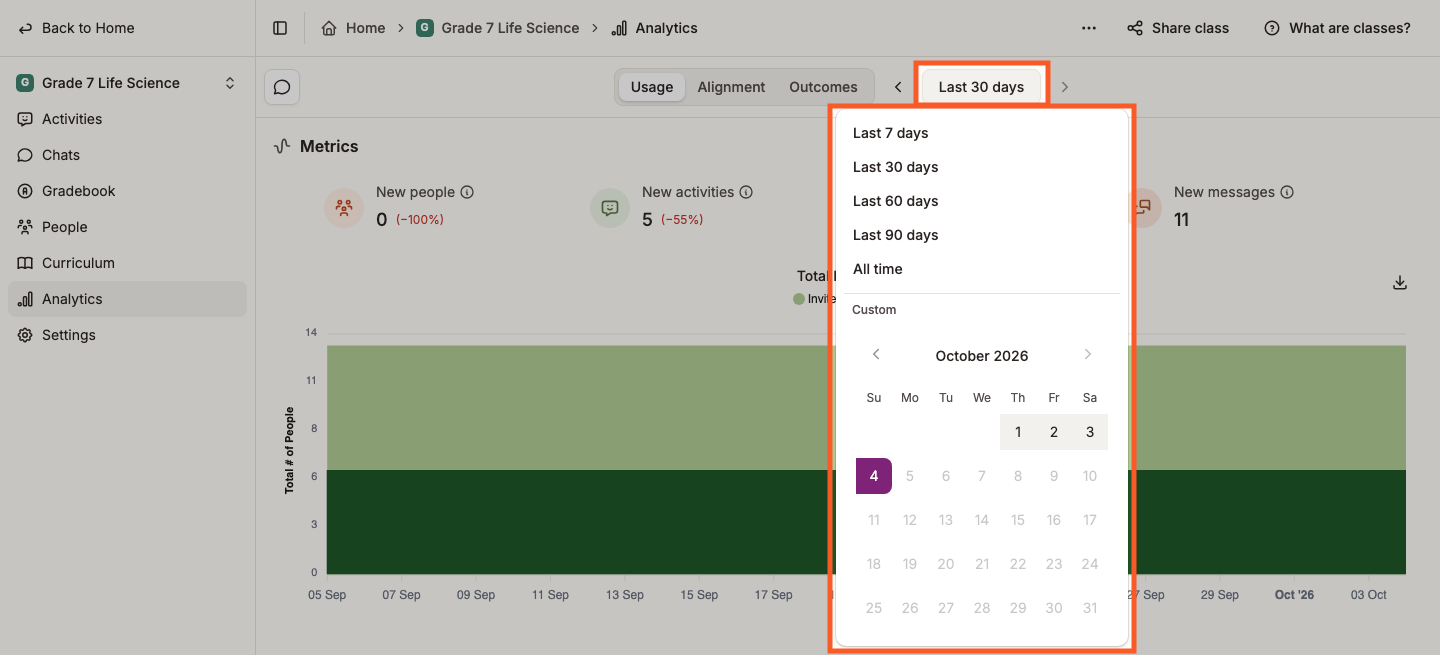
The button in the middle of the header sets the period for time-based usage, demonstrations and outcome trends. Pick Last 7 days, Last 30 days, Last 60 days, Last 90 days or All time, or click the first and last dates on the calendar underneath. The arrows on either side step back and forward one period at a time, so from a 30-day view the left arrow shows the previous 30 days.
People by Role and the Outcomes mastery, standards-pipeline and content-coverage charts show the current state, not a historical snapshot for your chosen dates.
The three tabs
Switch between them with the control at the top of the page.
| Tab | What it answers |
|---|---|
| Usage | How much the class is using Flint |
| Alignment | What kind of thinking the work is asking for, and what students are demonstrating |
| Outcomes | How the class is doing against the standards you have adopted in the class's Curriculum tab |
Usage
If Usage says "Nothing to see yet", use Add people to add participants and New Activity to create an activity. A class needs both before this dashboard shows usage charts; counts build as students work.
Metrics opens with four counts for the period — New people, New activities, New sessions and New messages — each showing how it compares with the period before. Below them sit Total People, New Activities, Sessions, and Messages, Active Users, Teacher vs. Student Usage and People by Role.
Active Users can run up to two hours behind. If your school has turned off usage analytics, usage charts may be empty or incomplete; zero displayed usage does not necessarily mean no student work.
Usage Details then breaks the same period down per person: Top Activity Creators, Activity Types, Activities Per Subject, Top Users by Sessions, Messages Sent in Chat, and a sortable table with a row per person showing activities created, classes created, messages sent and sessions submitted. Click a name to open that person's profile.
New sessions counts sessions started; the per-user session counts are sessions submitted. Drafts are excluded, and role labels reflect current assignments rather than historical roles.
Alignment
Summary holds the Soft Skills Sessions count, the Soft Skills radar across Flint's five transdisciplinary skills, Pulse (Sparky's read on what is going well and what to watch), Cognitive Rigor (Bloom's), and the Activity Types and Activities Per Subject breakdowns.
Underneath are carousels of real moments from sessions: Students' Soft Skills, a switch between Students' strengths and Students' areas for improvements, Inappropriate messages, Class Context Alignment and Pedagogical Alignment. Each card links to the message it came from. View all turns a carousel into a full grid.
If your school is on the free plan, this tab shows sample data instead, so you can see what it looks like before you upgrade.
Outcomes
The leading explorer switches between By usage and Over time. Choose a usage metric (sessions, messages or minutes) and an outcome metric (gaps closed per student, standards demonstrated or mastery gain), and filter by subject or grade. Choices marked not tracked are unavailable. Comparisons between usage and outcomes are not proof that usage caused an improvement.
Student outcomes counts the gaps closed in the period, the share of students Flint worked with, and the grading and standards-matching Sparky did for you. Standards Outcomes below it shows individual demonstrations, grouped by how the student engaged the standard. If no standards are adopted for the class yet, the tab says so and points you to the Curriculum tab.
Where students stand shows current mastery, Standards pipeline shows how standards progress from approved to covered, assessed and met, and Content coverage shows which standards are taught and assessed or still have gaps. These three charts describe the current state regardless of the date range.
This older recording includes loading and empty states and an earlier Outcomes layout. It does not show the current leading explorer described above.
Export a chart
Most charts and tables have a Download as CSV button in their top-right corner that saves what you are looking at as a spreadsheet.